I've been having fun recently with Lasers & Feelings and initially just wanted to make a quick little hack based in a fun and colourful world. Ideas turned into notes turned into scenarios turned into enhancements...
Long story short, I ended up with a 30 page adventure guide, two conflict mechanics, a bunch of set pieces and inspiration and a load of colourful characters.
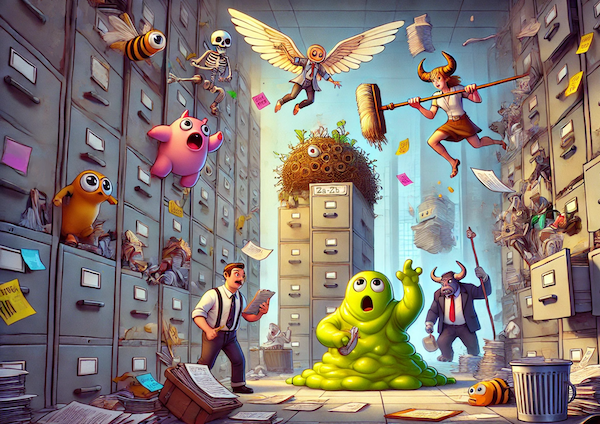
Monster Coffee Break combines RPG, fantasy and comedy horror tropes with the heady and intoxicating world of corporate bureaucracy.
MonsterCorp is a sprawling corporate office catering to all kinds of monsters, from goo blobs to banshees to vampire bats. Employees run everything from nightmarish supply chains to scream-powered HR seminars.
The office is absurdly bureaucratic. Monsters need forms, signatures, and permits for everything.
This is definitely not a full RPG system. It just grew out of my own notes while playing with Lasers & Feelings. It's meant to inspire your own game, provide some interesting ideas and generally be a bit daft.
Some things might not make sense, some might not work. That's fine, just roll with it.
Aside: I then used the opportunity to create a simple little one-page website for it and throw in some fun CSS to do with scroll snapping.
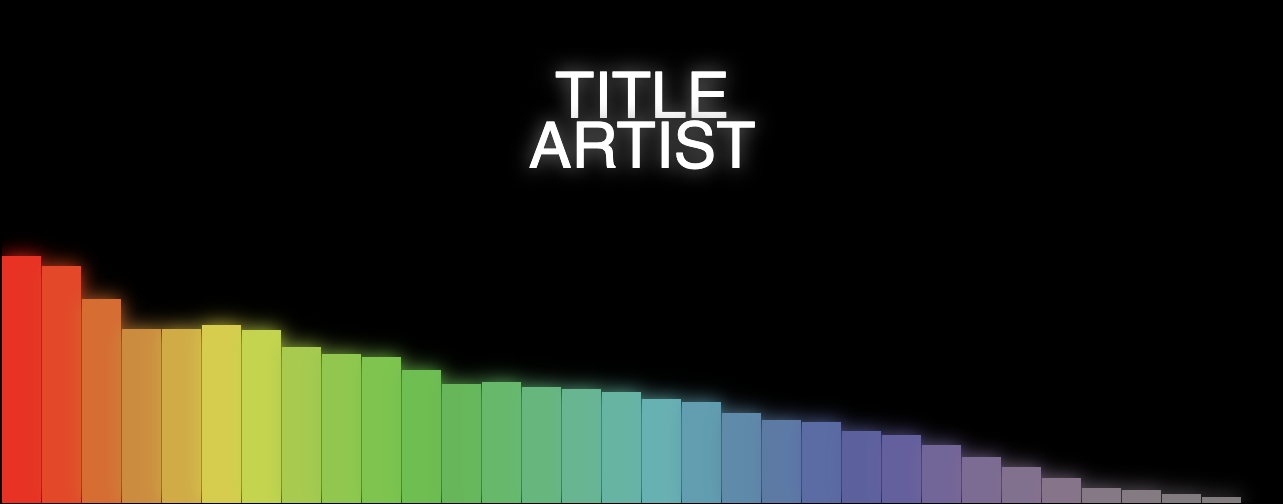
A very simple web app that generates a music visualisation from an audio file and renders it to a downloadable movie file. Most importantly, it does this all on the client side.
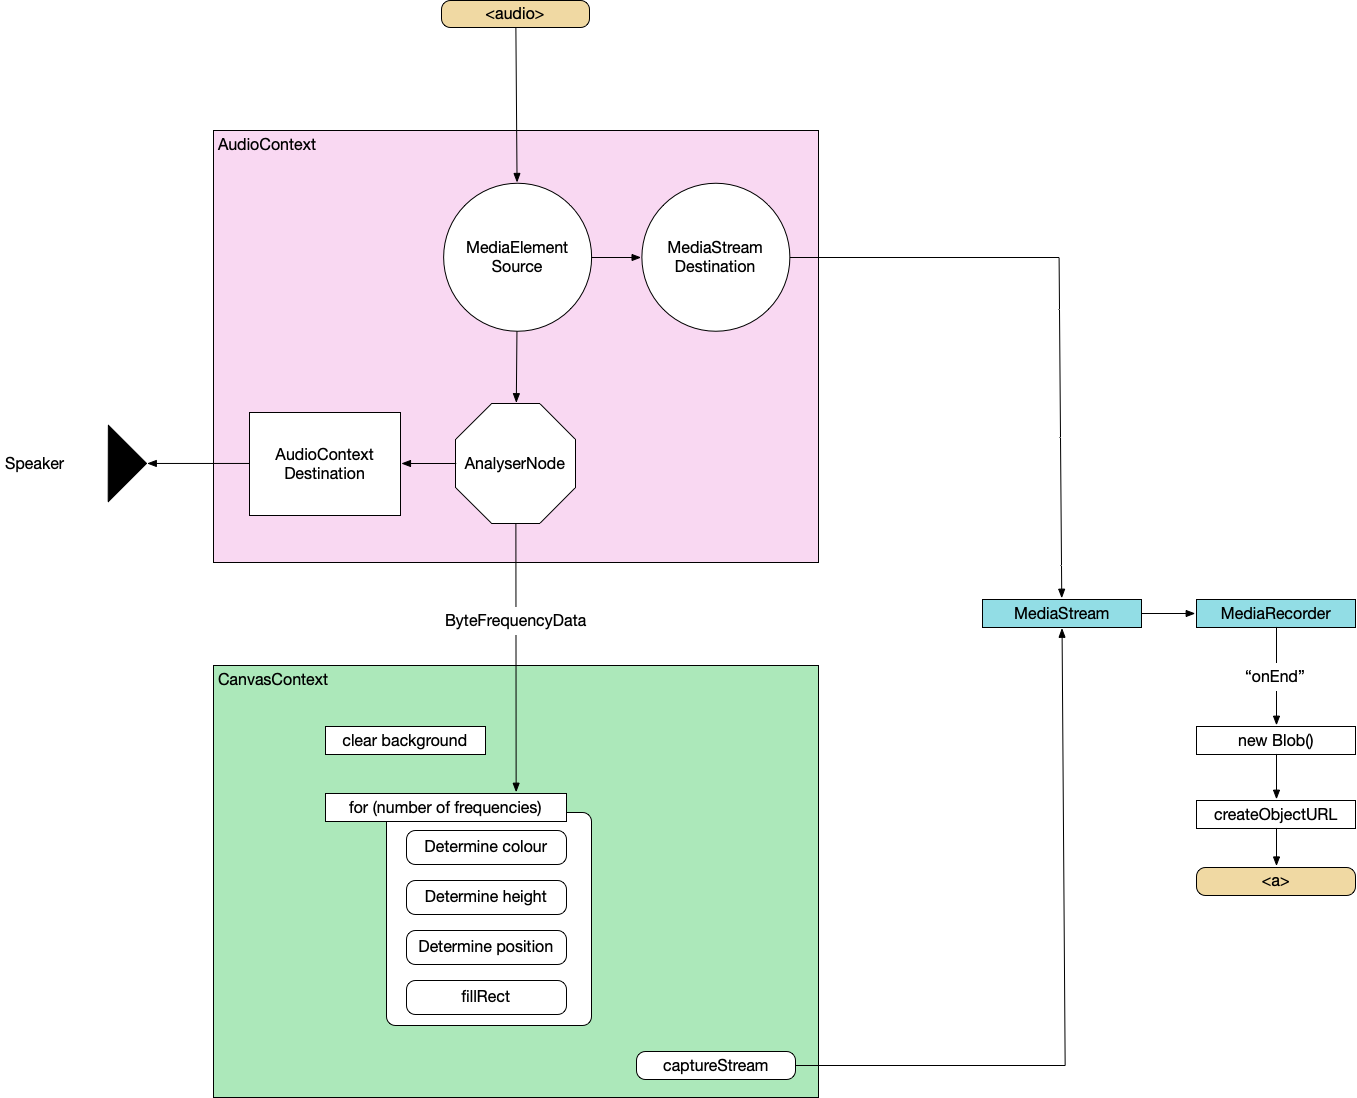
To do this, we'll combine the Web Audio API, Canvas API and MediaStream Recording API. I'll not be providing the complete source code as we go through it but just enough to point you in the right direction.
Create an AudioContext, source the audio from the <audio> element, prepare a streaming destination for later and connect the in to the out.
const context = new AudioContext();
const src = context.createMediaElementSource(audio);
const dest = context.createMediaStreamDestination();
src.connect(dest);
Attach an analyser node
We want our visualisation to react to the music so we need to wire in an AnalyserNode. Thankfully, this handles all the complicated audio processing so we don't need to worry about it too much. We also attach the analyser to the destination node of the AudioContext so that we can hear it through the computer speakers. Not strictly necessary but it's nice to be able to hear what we're doing.
the fftSize is essentially "How detailed do we want the analysis to be?". It's more complicated than that but this is all the detail we need for now. Here, we're using 64 which is very low but 512, 1024 and 2048 are all good. It depends on the actual visualisations you want to produce at the other end.
The smoothingTimeConstant is approximately "How much do we want each sample frame to be like the previous one?". Too low and the visualisation is very jerky, too high and it barely changes.
analyser.fftSize = 64;
analyser.smoothingTimeConstant = 0.8;

const bufferLength = analyser.frequencyBinCount;

// Prepare the array to hold the analysed frequencies
const frequency = new Uint8Array(bufferLength);
Finally grab the values from the <input> elements.
Now we do the standard canvas setup – grab a reference to the canvas, set our render size (doesn't need to be the same as the visible size of the canvas) and prepare a 2d context.
function renderFrame() {
  // schedule the next render
  requestAnimationFrame(renderFrame);

  // Grab the frequency analysis of the current frame
  analyser.getByteFrequencyData(frequency);

  // Draw the various elements of the visualisation
  // This bit is easy to modify into a plugin structure.
  drawBackground(ctx);
  drawBars(ctx, frequency);
  drawText(ctx, titleText, artistText);
}
function drawBars(ctx, frequency) {
  const widthOfEachBar = (canvas.width / frequency.length);

  // Loop over data array
  for (let i = 0; i < frequency.length; i++) {
    const heightOfThisBar = frequency[i];

    // Base the colour of the bar on its index
    const h = 360 * index;
    // Base the saturation on its height
    const s = 100 * (heightOfThisBar/256);
    const l = 50;
    const color = `hsl(${h}, ${s}%, ${l}%)`;

    ctx.fillStyle = color;

    // Add a little shadow/glow around each bar
    ctx.shadowBlur = 20;
    ctx.shadowColor = color;

    // Draw the individual bar
    ctx.fillRect(x, canvas.height - heightOfThisBar, widthOfEachBar - 1, heightOfThisBar);

    x += (widthOfEachBar);
  }
}
By this point, we can load a supported audio file and see some pretty pictures reacting to the music.
MediaRecorder
This section is copied almost word-for-word from StackOverflow
First, we'll create a combined MediaStream object from the audio data and the canvas data.
const chunks = []; // here we will store our recorded media chunks (Blobs)
const stream = canvas.captureStream(); // grab our canvas MediaStream

let combined = new MediaStream([
...stream.getTracks(),
...dest.stream.getTracks(),
]);
Next, we start recording that data chunk-by-chunk. We'll save it as webm.
The final video export. We convert the combined chunks (the Blob) into an object URL and create an anchor that lets us download it from the browser.
function exportVid(blob) {
  const a = document.createElement("a");
  a.download = "myvid.webm";
  a.href = URL.createObjectURL(blob);
  a.textContent = "download";
  document.body.appendChild(a);
}
This export call will be triggered after the audio has finished. You load an audio file, watch the visualisation play through, when it's finished, you click the download link and you get a webm.
So now, we have the basis for a complete music video generator – audio in, video file out.
Or watch a video generated using this basic version (as a bonus, this music was also automatically generated in the browser but that's a topic for another day):
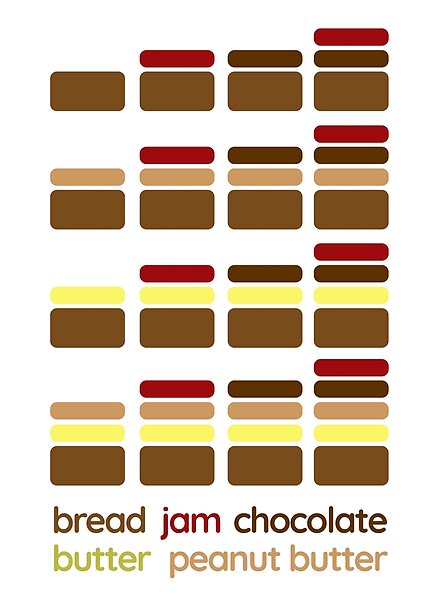
After many years of meaning to do it and not actually doing it, I decided to open an Etsy store. It's not my first online print store. In fact, one of the key reasons I ever learned HTML, CSS and PHP was to build an online store for my artwork back in... 2002? Seriously? Seventeen years ago...?
I really like how I could tie Etsy together with Printful so the prints are generated on demand rather than me holding a lot of stock which is how we did it back in the olden days...