What do Prince of Persia, Apollo 11, and Spacewar! have in common?
They were built by geniuses, powered by sheer grit, and written in programming languages that have mostly been buried with floppy disks and punch cards. They’re ancient, brittle, and borderline unreadable by modern standards—and yet, they’re masterclasses in creative problem-solving. The kind of code that teaches you how to think, not just how to import a library.
One of the reasons I enjoy building Komment is that I get to use it to read these projects without having to dust off old Assembly references – I don’t have to be fluent in Pascal, 6502 Assembly, or ye olde pre-ANSI C to learn from them.
⸻
🕰 Why Old Code Still Has Something to Teach Us
We tend to think the past has nothing for us—especially in tech. Everything moves so fast. New frameworks, new languages, new “best practices” every 18 months.
But when you look at the code behind something like the original Prince of Persia, you see a developer solving incredibly hard problems with almost no resources. No GPU. No high-level abstractions. Just a few kilobytes and some really clever hacks.
Studying that codebase is like looking at a stunning cathedral. Then getting closer and seeing it's built with lego. Then getting closer and seeing that the lego bricks were hand carved.
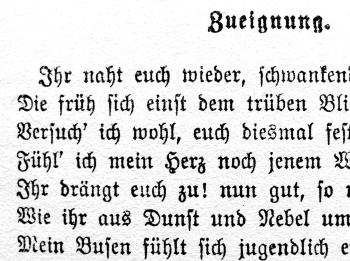
The codebase has some clever things to learn from but it’s like trying to learn German by sitting down with a copy of Goethe printed in Fraktur. It’s possible. But it’s going to take a long time to figure out what's actually going on.
The Problem with Legendary Codebases
Here’s the experience of trying to learn from one of these classic codebases:
- You download the repo. It’s full of files with extensions you’ve never seen.
- The comments are in all caps. Some are in French. Some lie.
- There’s no structure. No docs. Just a cryptic main loop and prayer.
You want to understand the sprite engine. Instead, you’re 400 lines deep in something called MOVE.S that appears to control both jumping and wall collisions and maybe the music system? It’s chaos. Beautiful, historical chaos.
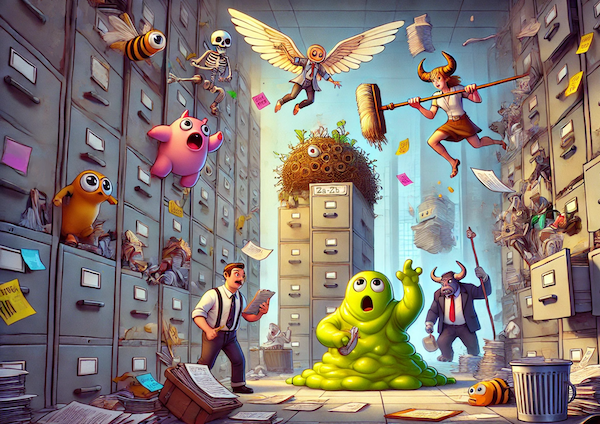
Enter Komment: The Code Archaeologist’s Toolkit
One of my favourite things to do with Komment is point it at one of these projects and have the system parse the codebase and turn it into something much easier to grok.
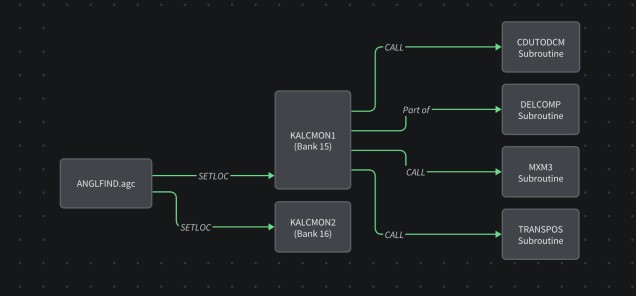
And it comes with diagrams
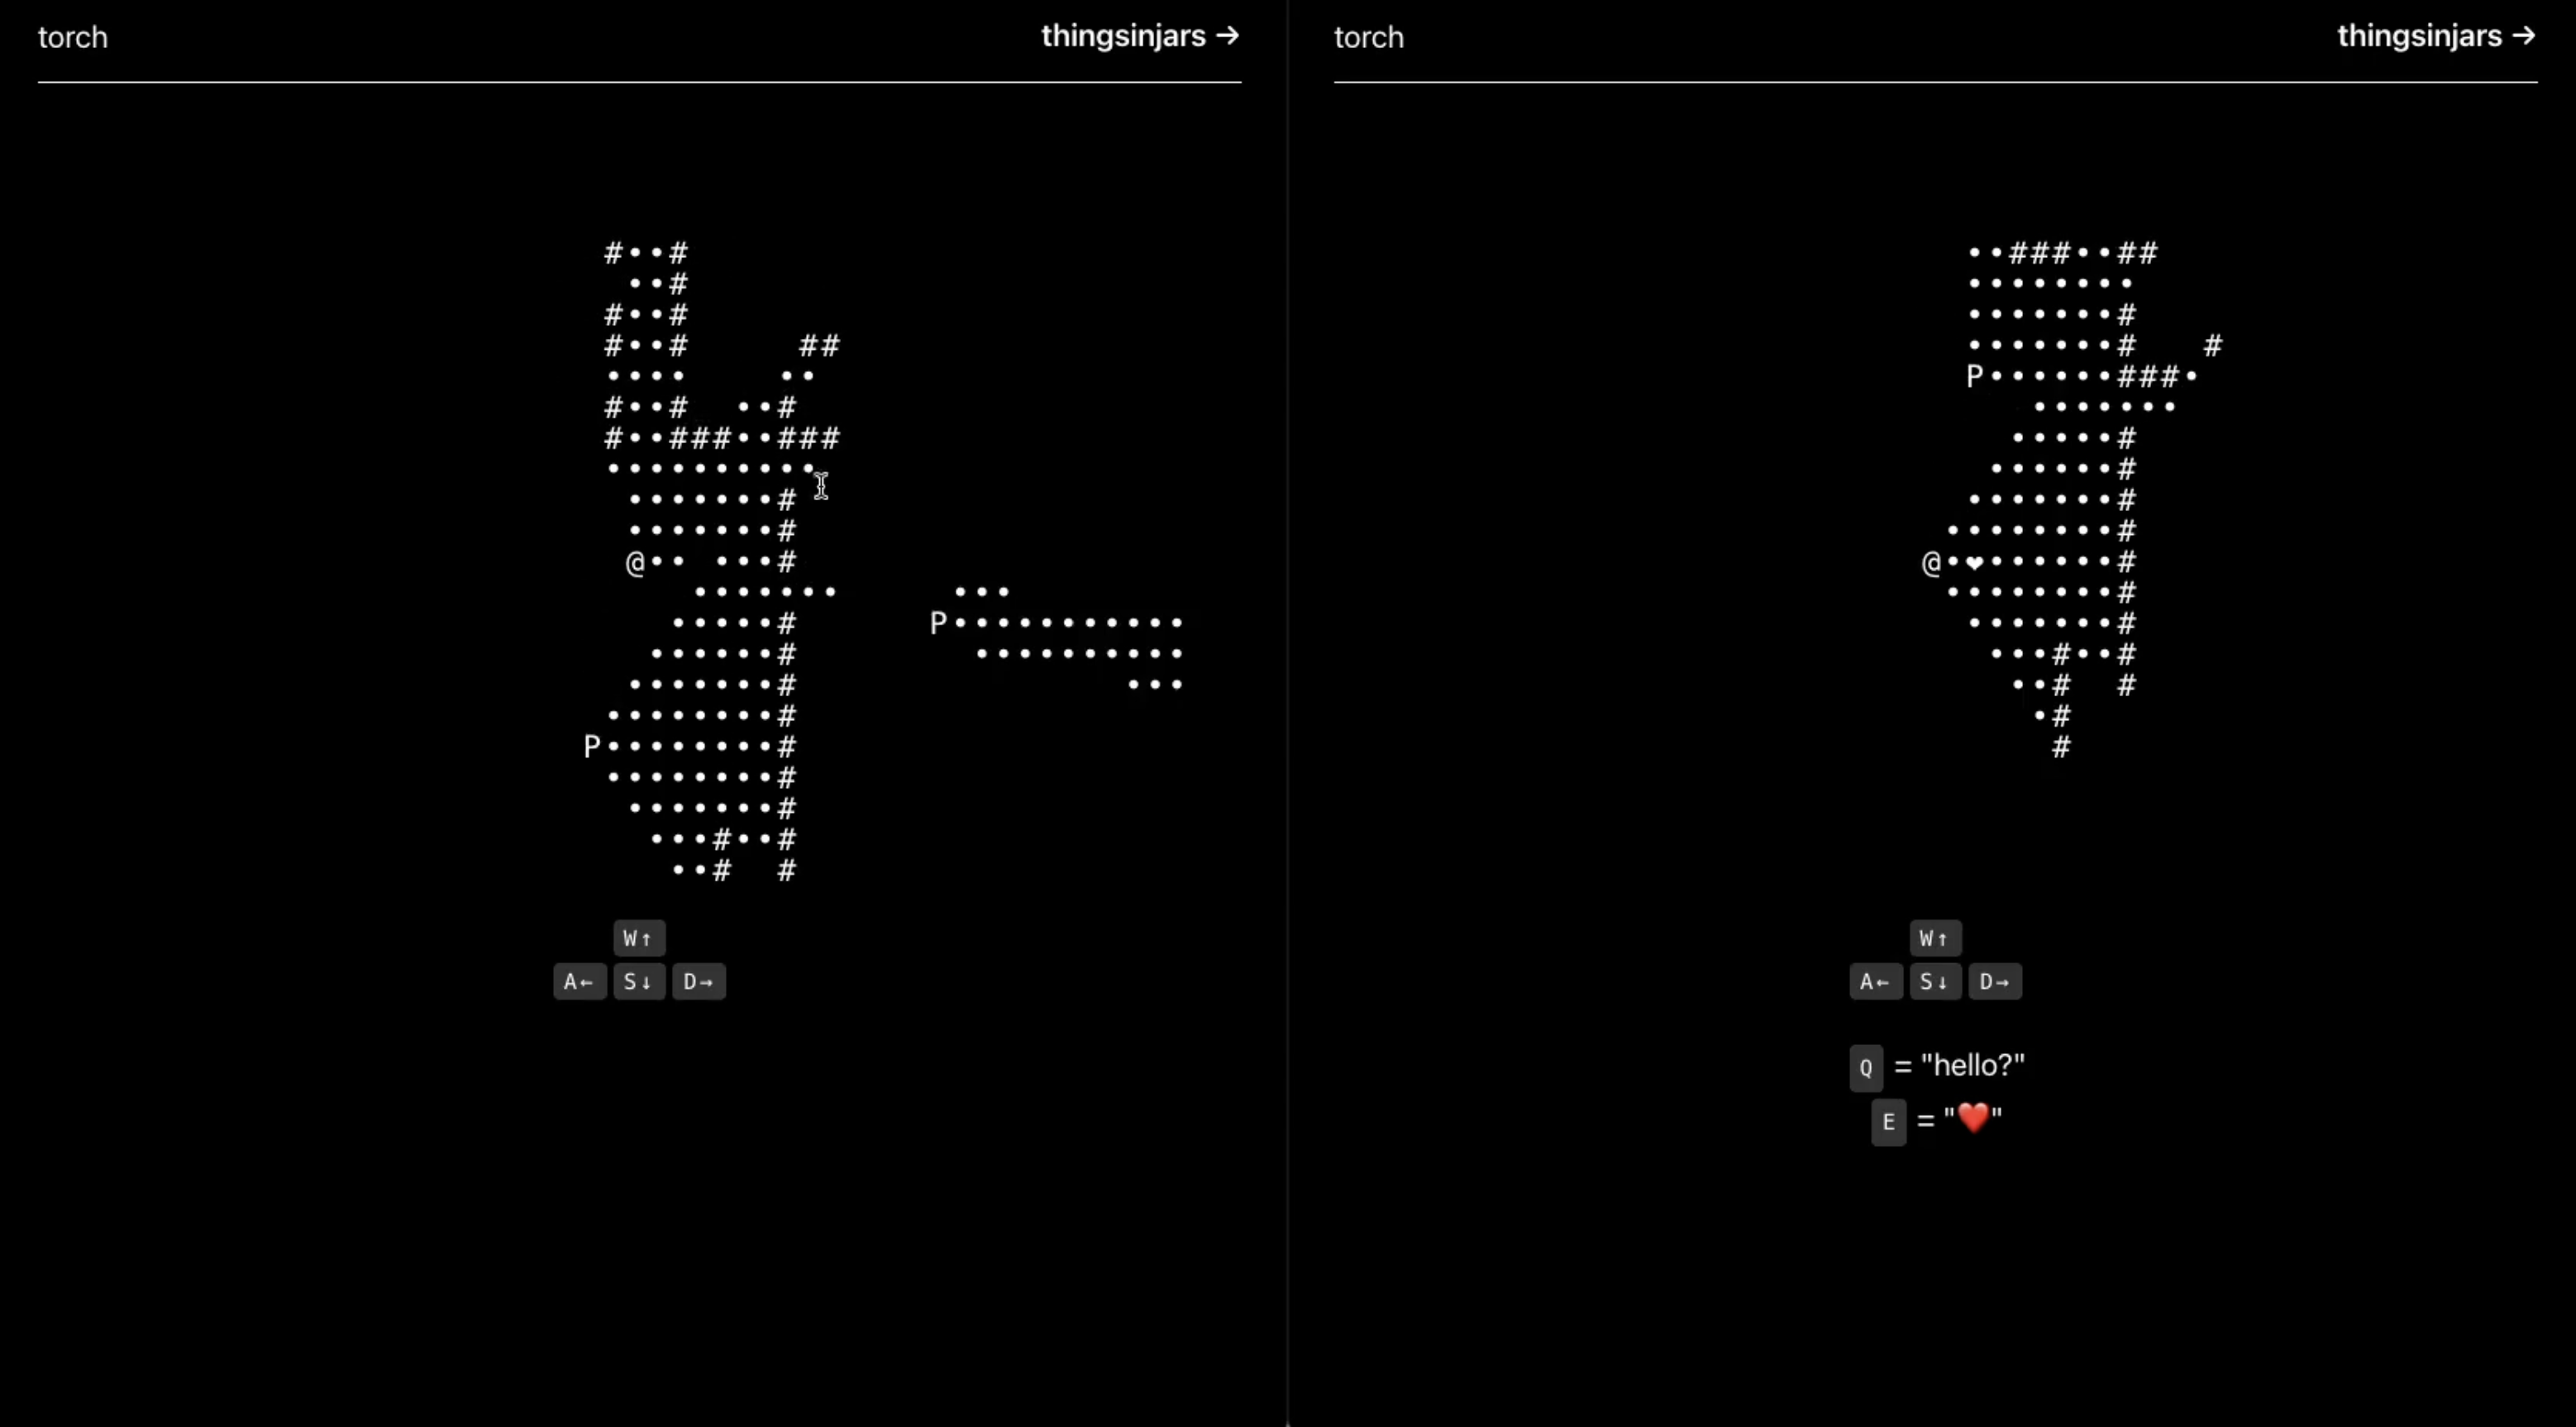
🕹 Case Study: Following the Flow of Spacewar!
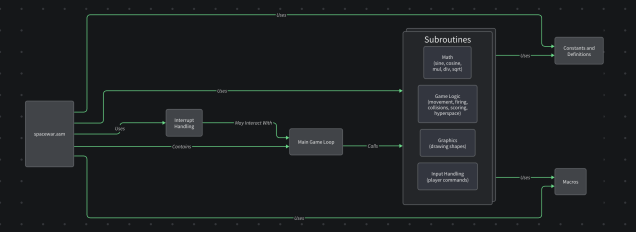
Take Spacewar!—one of the earliest digital games, built in 1962. It was designed on a PDP-1, a machine that predated basically everything except carbon.
I threw it into one of our pipelines and got out a breakdown of how it does what it does.
You’re no longer staring into the abyss. You’re walking through the code like a museum exhibit, with a helpful guide whispering in your ear.
Check out the Spacewar! wiki on Komment